Why did my OnlyFans revenue drop today? A metric checklist for agencies
A model makes noticeably less today than on a normal day. The owner asks the team, the team blames quiet fans, and by evening nobody knows more than in the morning. A drop almost always has a cause you can see in the numbers. Here is the order in which we check them, and how Leeward puts the answer on the first screen.
Why “the fans were quiet” is rarely the answer
Revenue of an agency model is a sum of a few streams: PPV sold in chat, subscriptions, tips and referrals, minus refunds. When the total falls, it is usually one stream that moved. Guessing which one costs a day. Looking at the same few metrics every morning finds it in minutes, and tells you whether the fix is in traffic, in the chat or in the schedule.
The checklist below works for OnlyFans and Fansly models alike. In Leeward both platforms live in one app, so you run it from one dashboard and switch between OF and Fansly at the top.
The checklist: six things to check, in this order
1. Revenue mix: which stream fell
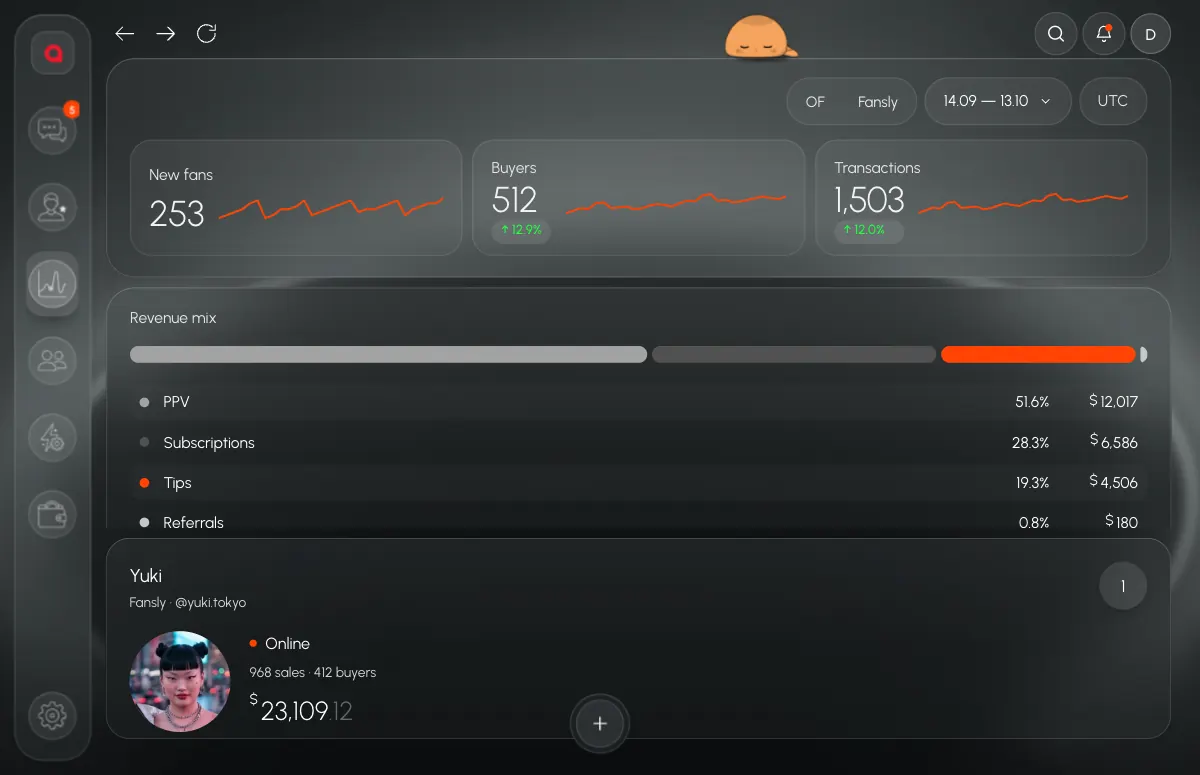
Start with the revenue mix: PPV, subscriptions, tips, referrals and refunds, each with its share and amount. If subscriptions are flat and PPV fell, the problem is in the chat, not in traffic. Look at the refunds line too. A burst of refunds can eat an otherwise normal day, and it needs a different conversation than slow sales.
2. New fans, buyers and transactions
These three cards sit at the top of the dashboard, each with a change against the comparison period and a small trend line. Read them together:
- Fewer new fans means the top of the funnel moved: promotion, links, the For You page on Fansly.
- Same new fans, fewer buyers means fans arrive but don’t convert. That is a chat and offer problem.
- Same buyers, fewer transactions means people buy less often. Check the average check and how many PPV went out.
3. Reply speed
Slow replies quietly kill PPV sales. A fan who waited twenty minutes is often gone. Check the team’s reply median for the day. If it grew, the next question is who was on shift and who kept fans waiting. We cover that in how to monitor chatters in real time.
4. Shift hours and $/hour
A short or empty shift looks exactly like a bad day for the model. Compare shift hours with a normal day and look at the team’s $/hour. If hours fell and $/hour held, nothing is wrong with the chatters; the schedule had a hole. If hours held and $/hour fell, look at the people. The timesheet that feeds these numbers is the same one payroll uses, see how to pay chatters from a timesheet.
5. PPV unlock
PPV unlock is the share of sent PPV that fans actually bought. Chatters can send as many PPV as yesterday and sell fewer. Usual reasons: the price jumped, the offer came too early in the conversation, or the fan already got that media. In Leeward every fan card shows PPV history with bought and not bought, and the vault warns when a file was already sent to this fan.
6. Whales, rebill and churn
Finally, look at concentration. ARPPU, the whales tile, rebill, churn and active subscriptions tell you how much the model depends on a few big spenders. If one whale didn’t buy today, the day looks bad although nothing broke. If churn grows week after week, the problem is bigger than one day. The Expiring and Expired filters in the inbox show who is about to leave.
How Leeward answers “why” on its own
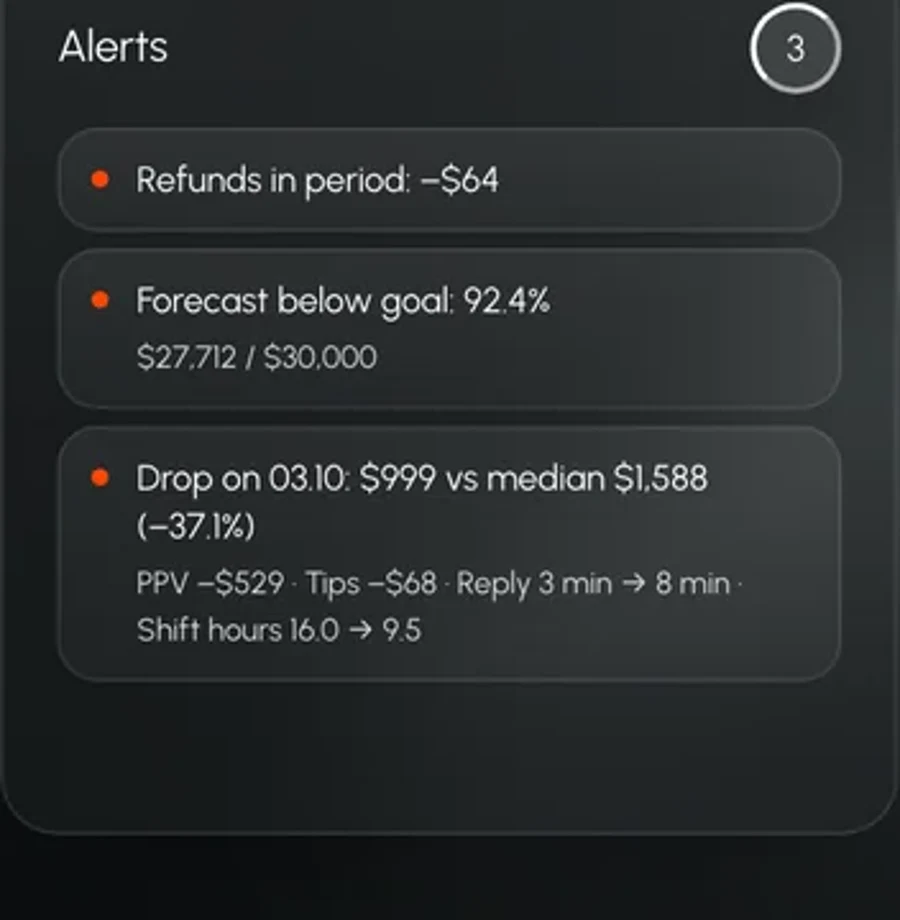
Going through six screens every morning gets old fast. When a day drops, Leeward shows why on its own: fewer PPV sales, slower replies, shorter shifts. The reason sits next to the number, so you don’t have to collect it from different tabs. Leeward also tells you whether the month is on track for your goal.
Each tile on the dashboard opens a panel with Money, Fans, Team and FYP tabs, so you can go from “revenue is down” to the chatter or the fan segment behind it in two clicks. Pick a period, compare it with another one, and switch between OF and Fansly.
Base metrics come with every plan. Extended metrics and alerts are part of higher plans, see pricing.
What the platform does not tell you
Be honest about the limits of the data. Fansly statistics come in with a delay of a few days, so yesterday on Fansly can look lower than it really was and fill in later. Don’t judge a Fansly day before its stats settle. Chat data such as PPV sent and bought, reply time and shift hours is visible as it happens, so start there.
Some things the platforms don’t report at all. For example, whether a fan opened a mass message is not available. Don’t build decisions on a number nobody can see.
A ten-minute morning routine
- Open the dashboard and compare yesterday with the same weekday a week earlier.
- Read the revenue mix. Find the one stream that moved.
- If PPV fell, open the Team tab: reply median, PPV unlock and hours for each chatter.
- If new fans fell, look at traffic: tracking links, and the FYP view for Fansly models.
- Check whales and expiring subscriptions. An automation like “subscription is about to expire” or “a paying fan is online” can send a message or notify a manager in Telegram.
- Write down the cause and one action for today. Next morning, check if it worked.
The routine works because the same numbers are read the same way every day. After two weeks the team knows what a normal day looks like, and a drop stops being a mystery.
Leeward runs OnlyFans and Fansly in one desktop app for macOS and Windows. Download it and every model you connect gets a 7-day free trial.